Pressure to publish and the prevalence of positive results
Originally at https://meta-science.tumblr.com/post/50834873214/pressure-to-publish-and-the-prevalence-of-positive-results
This PLoS One study attempted to look at how pressure to publish might influence the prevalence of positive results. The author, Daniele Fanelli, made an odd choice by using ‘papers per capita by state’ as the measure of pressure to publish. The state seems way too macro a level to look at. I would expect pressure to vary strongly between schools and between departments within schools. There’s no reasoning for this given in the paper - I suspect that it was just simpler to use this measure, already provided by the NSF, then to come up with a method for looking at individual institutions.
The author reports a significant correlation of the percentage of papers that reported positive results with the per capita academic productivity of the state the author was from (b = 1.383±0.682, Wald test = 4.108, df = 1, p = 0.043, Odds-Ratio (95%CI) = 3.988(1.047–15.193)). I have very little formal statistical training, so take my opinions with a grain of salt:
-
That p-value is very modestly significant.
-
The confidence interval for the odds ratio is quite broad, stretching almost to 1 (or “no difference”) on the lefthand side.
-
Why does the author report the slope coefficient (b) instead of the correlation coefficient ®?
-
The slope or regression coefficient (b) represents the slope of the regression line. So I’d interpret the statistic as saying that for every “unit” of pressure increase, there’s an increase of 1.383 “units” of positive publication bias increase. However it’s not clear from the paper what the units are. Also, note that the standard error of b is almost half the size of b.
My final critique is of the dataset. The author analyzed 1316 papers randomly. The distribution was such that some states had a large number of papers to analyze (such as California, which had 150) and some had a very small number (such as Wyoming, with 1). One state, Delaware, was excluded from the analysis because no papers were found in the random sampling. You can see the full set here:
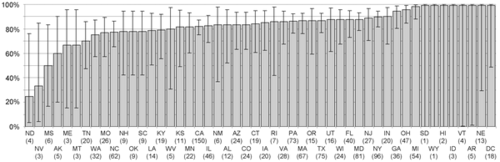
Wyoming and South Dakota get listed as having a 100% positive publication rate, based on an n of 1. Nebraska and DC also get listed as having a 100% positive rate, based 13 and 18 papers, respectively. Michigan, which seems to have about a 97% positive rate (eyeballing, the author does not provide the actual stats), is based on 54 papers. It doesn’t seem sensible to treat these data points equally. While it would doubtless have taken the author a lot of time and energy to random-sample his way up to reasonable sample sizes, he could also have used a stratified random sampling approach that I don’t think would have compromised the results.
In the end, I don’t put much stock in the results of this study, though I’m very sympathetic to the author’s overall points. Please do let me know if you spot any flaws in my analysis.